- KDDI HOME
 Corporate Information
 - Investor Relations
- Financial Data
- Performance Analysis
Performance Analysis
Analysis of Consolidated Statement of Income (Years ended March 31) [ 1]
1]
Operating Revenues/Net Sales
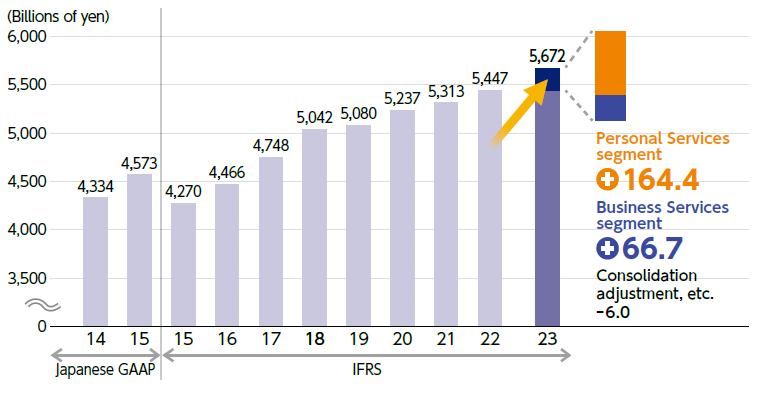
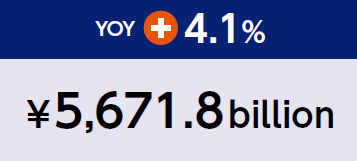
Increase in Energy business revenue and revenue in focus areas of Business Services segment and financial business resulted in net sales increase by 4.1% year-on-year to ¥5,671.8 billion.
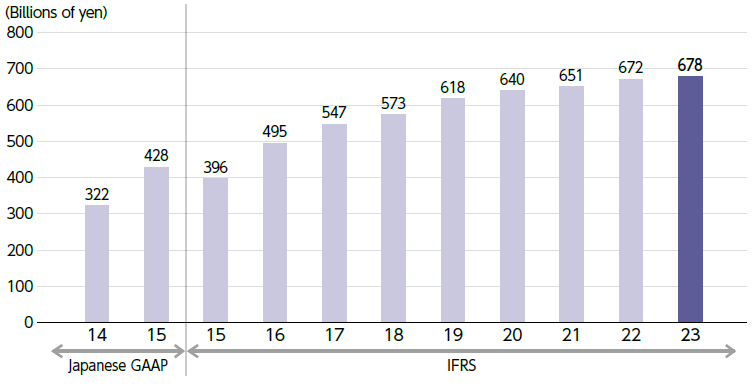
Operating Income
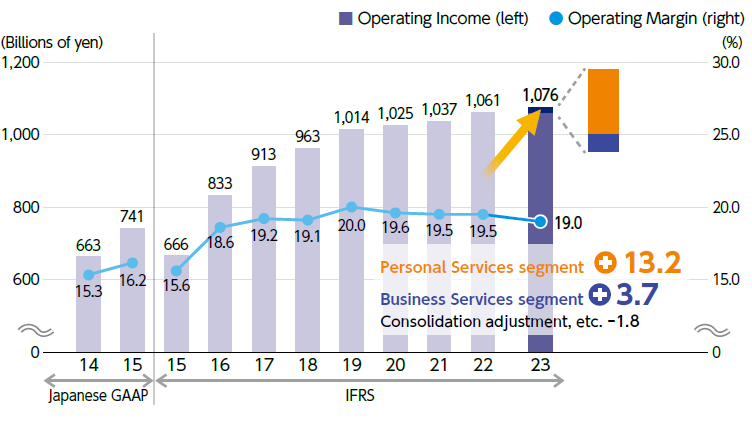
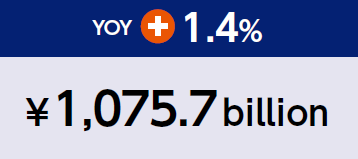
Operating income increased by 1.4% year-on-year to ¥1,075.7 billion mainly due to increased operating revenue and cost efficiencies, despite the effects of fuel price hikes and telecommunication failures.
Net Income/Profit for the Year Attributable to Owners of the Parent
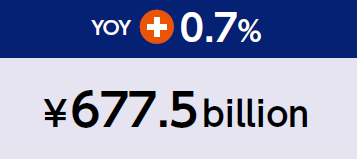
Due to the increase in operating income, profit for the year attributable to owners of the parent increased by 0.7% year-on-year to ¥677.5 billion.
Dividends per Share
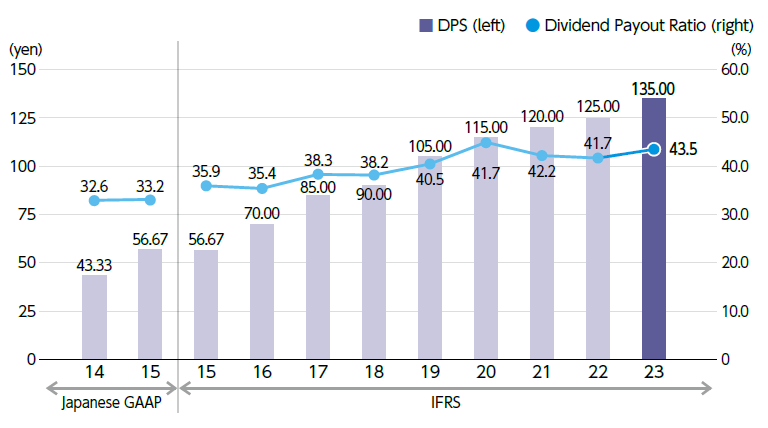
The annual dividend was ¥135, an increase of ¥10 year-on-year, and the consolidated dividend payout ratio was 43.5%. For FY24.3 we plan to increase the dividend per share (DPS) by ¥5 to ¥140 and aim for 22 consecutive periods of DPS growth.
Interest-Bearing Debt

Interest-bearing debt increased by ¥51.3 billion year-on-year to ¥1,651.4 billion, mainly due to an increase in corporate bonds and lease obligations.
D/E Ratio

Although interest-bearing debt increased, equity attributable to the owners of the parent also increased. As a result, the D/E ratio was 0.32, the same as at the end of the previous fiscal year.
Total Assets
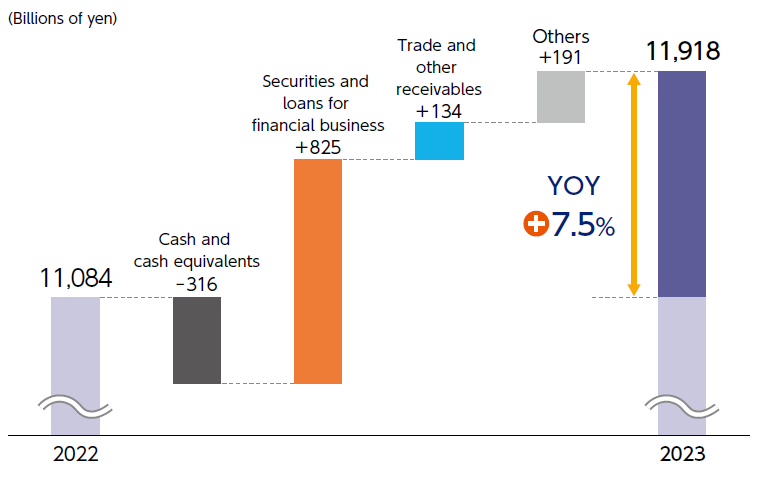
Total assets increased by ¥833.3 billion year-on-year to ¥11,917.6 billion, due to an increase in loans and securities for the financial business and trade and other receivables, despite a decrease in cash and cash equivalents, etc.
Capital
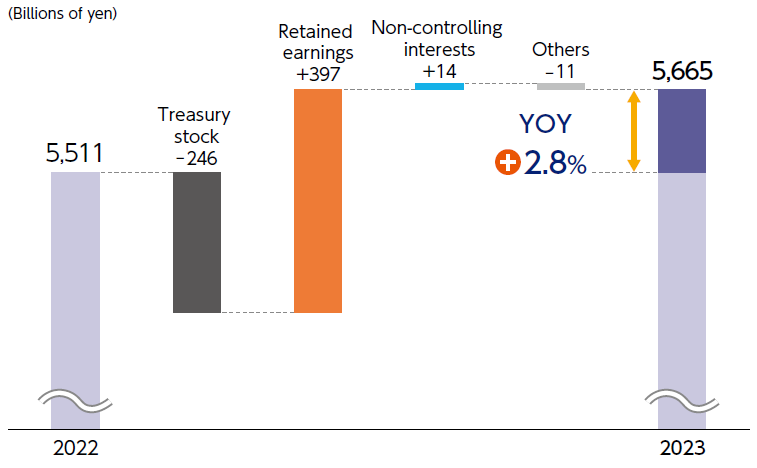
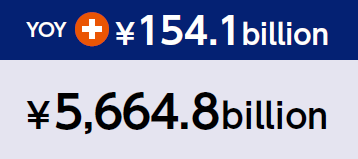
Despite the acquisition of treasury stock, mainly due to the increase in retained earnings due to higher profit for the period, capital increased by ¥154.1 billion year-on-year to ¥5,664.8 billion.
Capital Expenditures (Payment Basis)
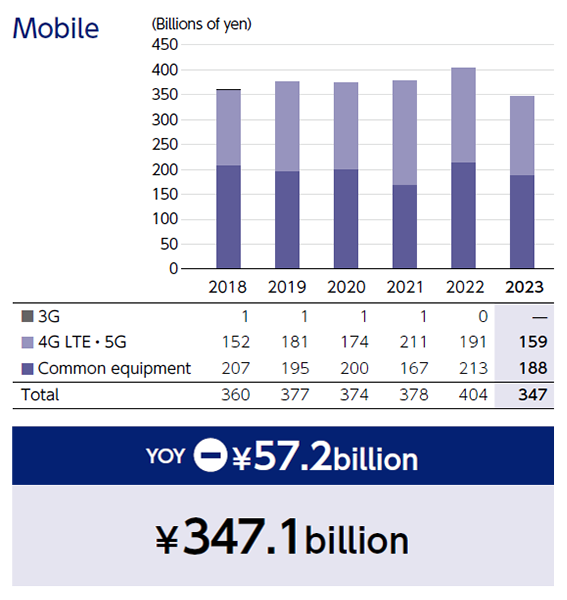
In the mobile business, mainly due to a decrease in 4G investment, capital expenditures decreased by ¥57.2 billion year-on-year to ¥347.1 billion.
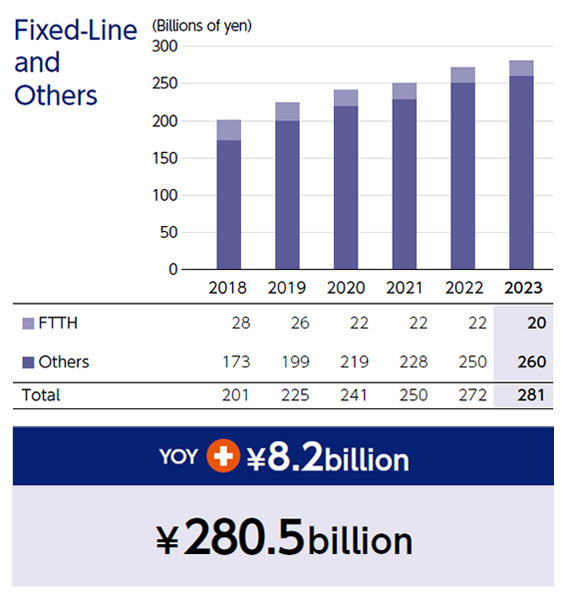
In the fixed-line and others, mainly due to increased data center-related investments at overseas subsidiaries, capital expenditures increased by ¥8.2 billion year-on-year to ¥280.5 billion.
Free Cash Flows
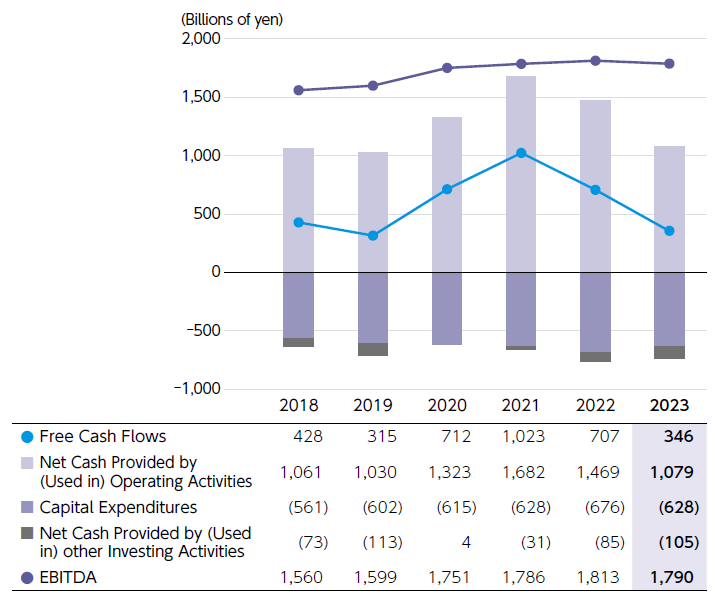
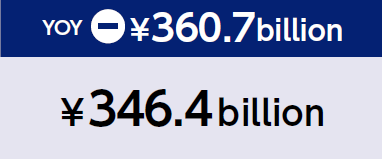
Net cash provided by operating activities (revenue) amounted to ¥1,078.9 billion, a decrease of ¥389.8 billion year-on-year due to an increase in loans for financial business.
On the other hand, cash flow used in investing activities (expenditure) decreased by ¥29.1 billion year-on-year to ¥732.5 billion mainly due to a decrease in 4G investment.
- For more information
- Other IR Information
Investor Relations
E-mail Alerts
- KDDI IR Official Twitter
- Recommended Contents
-