- KDDI HOME
 Corporate Information
 - Investor Relations
- Financial Data
- Performance Analysis
Performance Analysis
As of March 2026
Analysis of Consolidated Statement of Income (Years ended March 31)
Operating Revenue
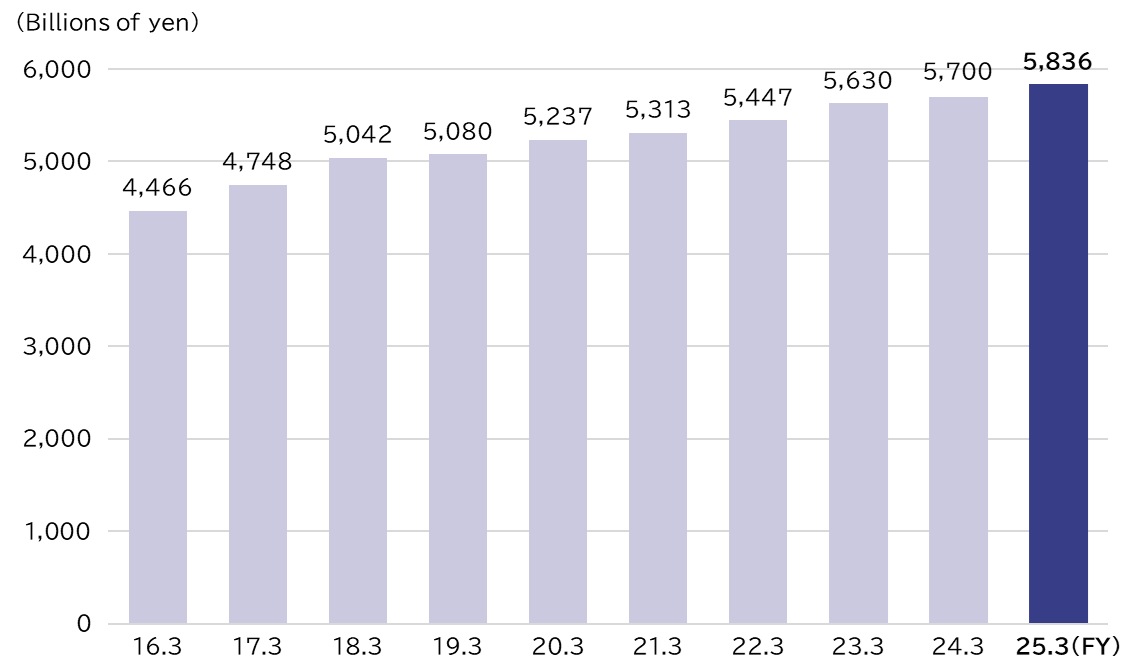
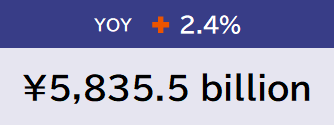
Operating revenue increased by 4.1% year-on-year to ¥6,071.9 billion, due to mobile revenue from our telecommunications business, our revenue increased due to growth in our growth domains, which consist of our financial business, IoT-related services, and Data centers.
Operating Income
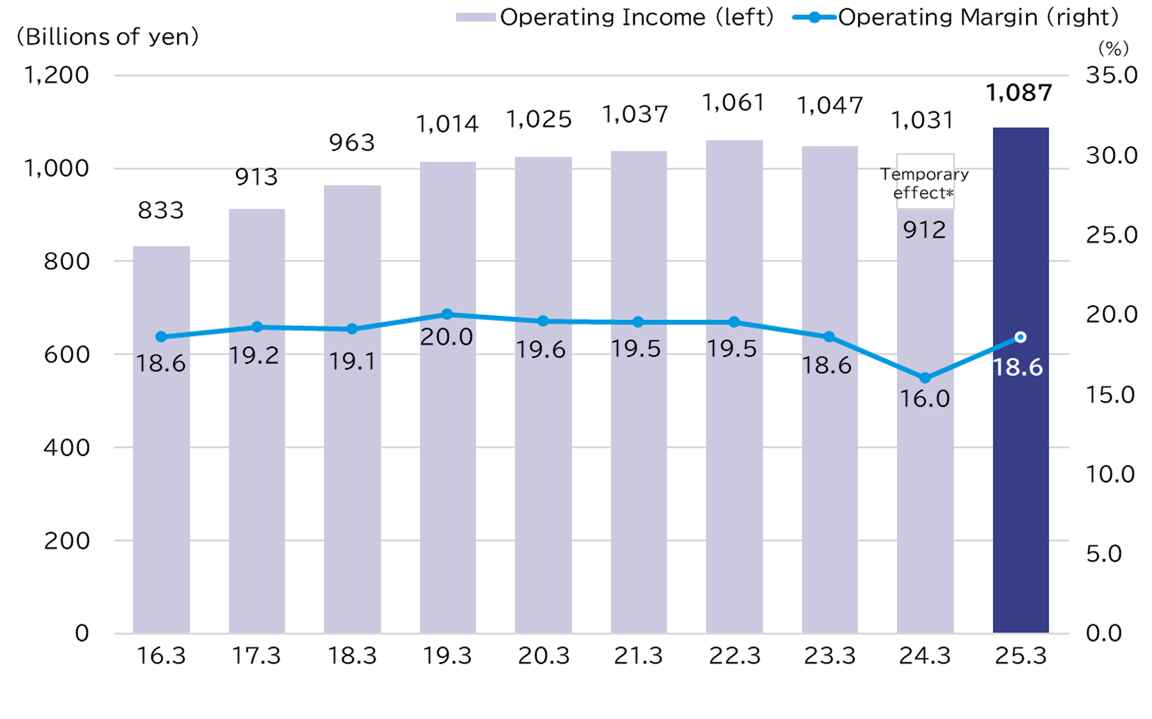
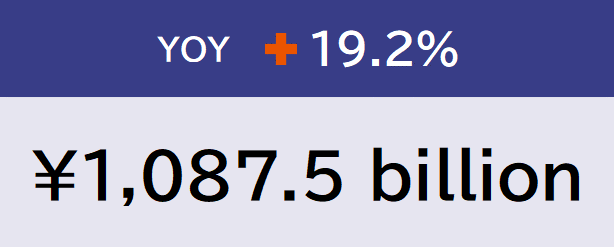
Operating income increased by 1.1% year-on-year to ¥1,099.1 billion, due to the expansion of growth areas, including double-digit growth in DX, and an increase in income from our equity method investment in Lawson following its acquisition, in addition to mobile growth.
Profit for the Year Attributable to Owners of the Parent
Due to factors such as growth in operating income and the impact of a capital reduction in Myanmar, profit for the year attributable to owners of the parent increased by 7.9% year-on-year to ¥707.1 billion.
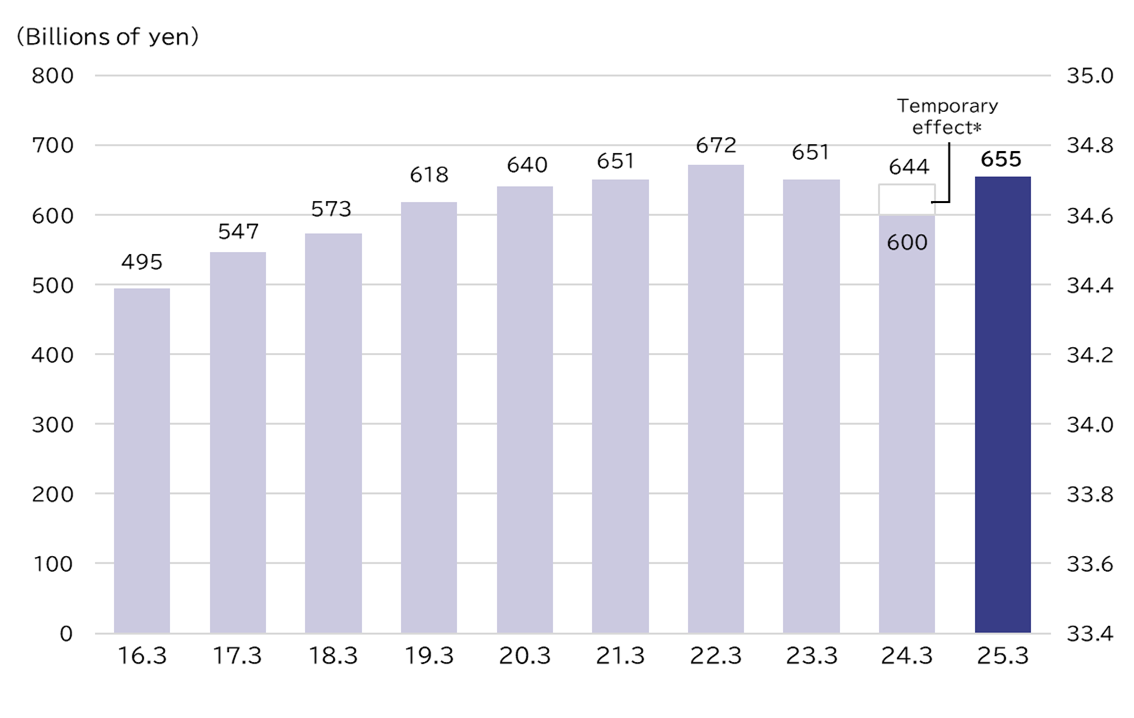
- *Temporary impacts of provision for lease receivables for the Myanmar telecom business and impairment and provision for removal of low-utilized telecom equipment.
Dividends per Share
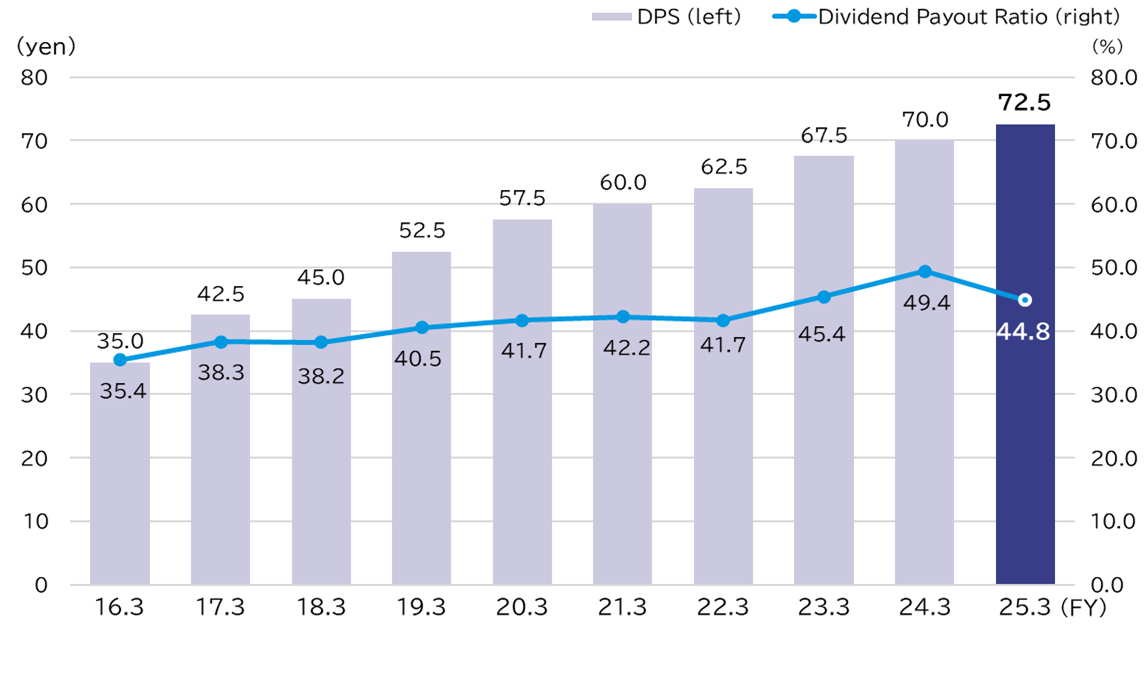
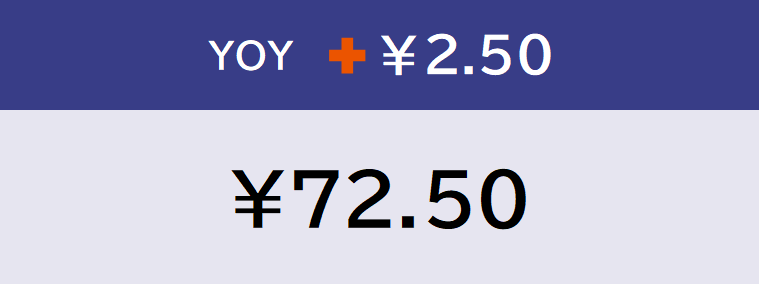
The annual dividend was ¥80, an increase of ¥7.5 year-on-year, and the consolidated dividend payout ratio was 43.6%. For FY27.3, we plan to increase the dividend per share (DPS) by ¥4.0 to ¥84 and aim for 25 consecutive periods of DPS growth.
Interest-Bearing Debt (figures in parentheses exclude the financial business)
Due to an increase in corporate bond issuance and lease obligations, interest-bearing debt increased by ¥937.8 billion year-on-year (an increase of ¥450.5 billion excluding the financial business), reaching ¥5,375.4 billion (¥3,269.4 billion excluding the financial business).
D/E Ratio (figures in parentheses exclude the financial business)
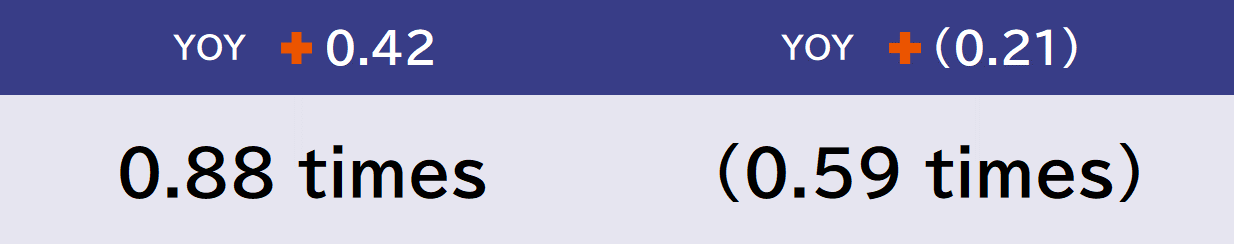
Due to the increase in interest-bearing debt, the D/E ratio increased by 0.18 points year-on-year (an increase of 0.10 points excluding the financial business) to 1.06 times (0.69 times excluding the financial business).
Total Assets
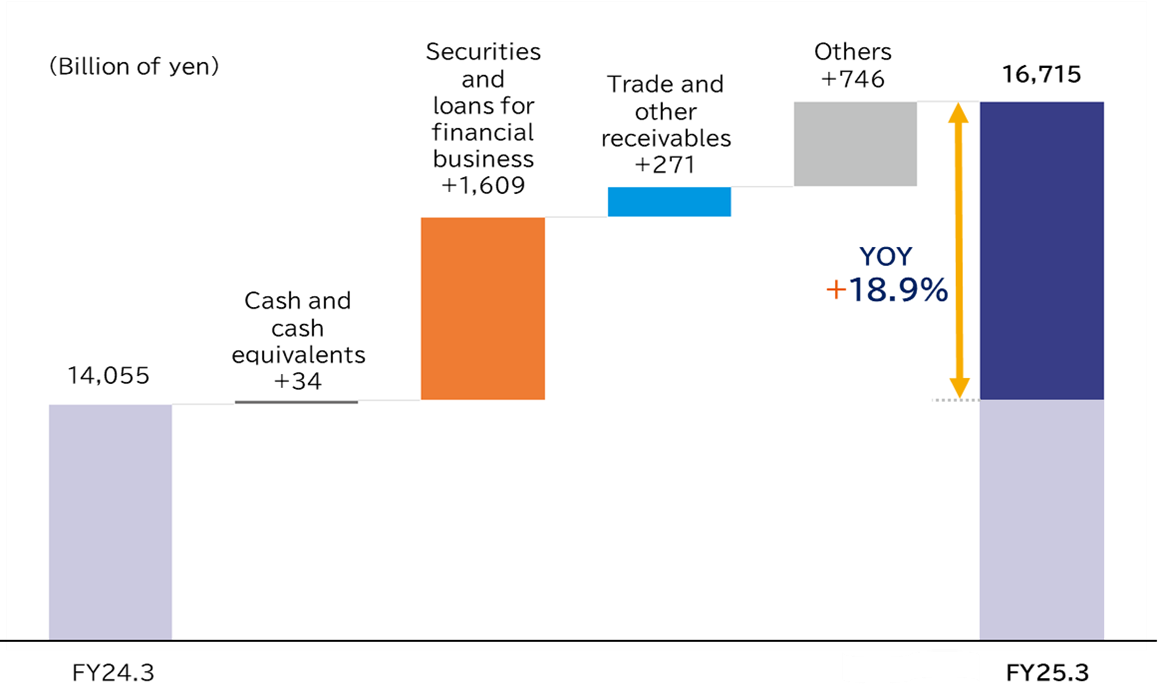
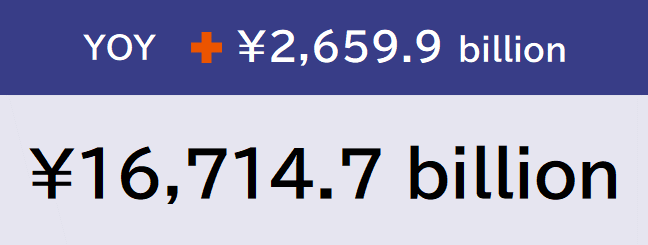
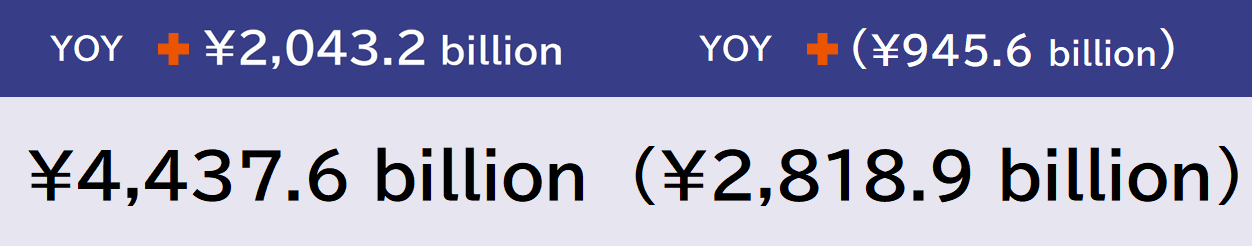
Although call loans and other items decreased, total assets increased by ¥2,348.7 billion compared to the end of the previous consolidated fiscal year to ¥19,063.4 billion. This was due to an increase in items such as loans in the financial business, and trade and other receivables.
Total Equity
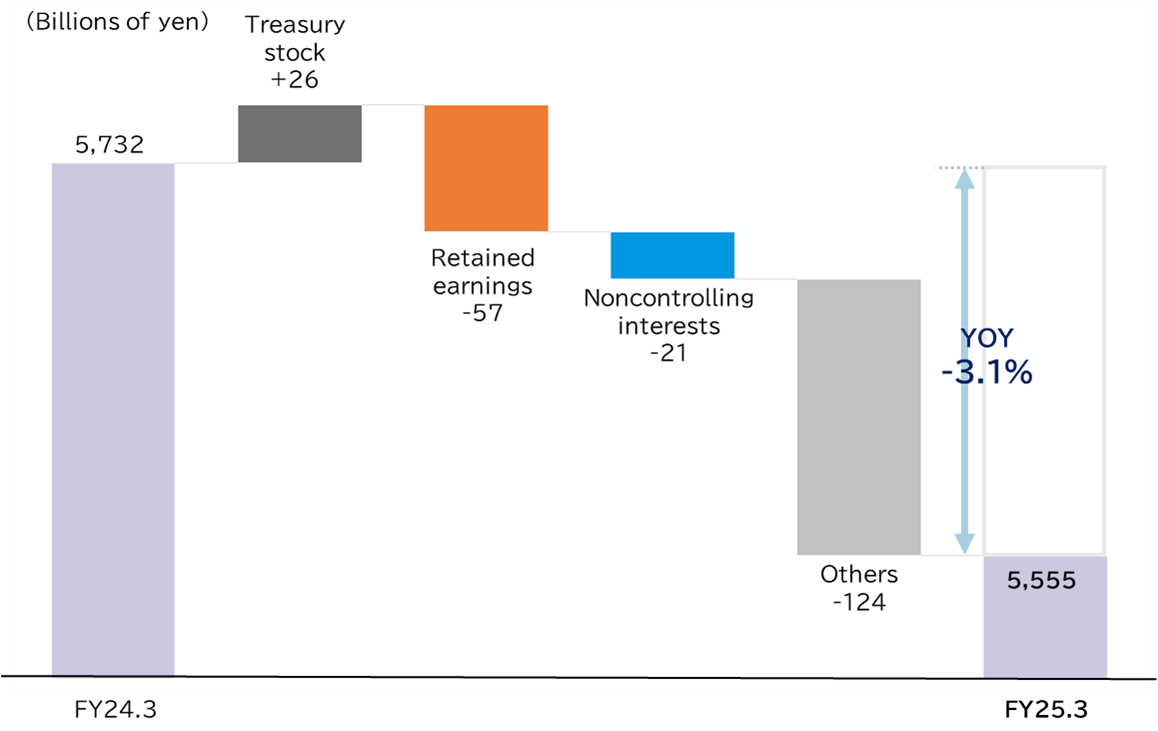
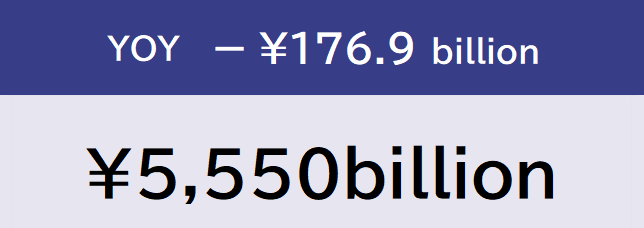
Mainly due to an increase in equity attributable to owners of the parent, total equity increased to ¥5,592.7 billion.
Capital Expenditures (Payment Basis)
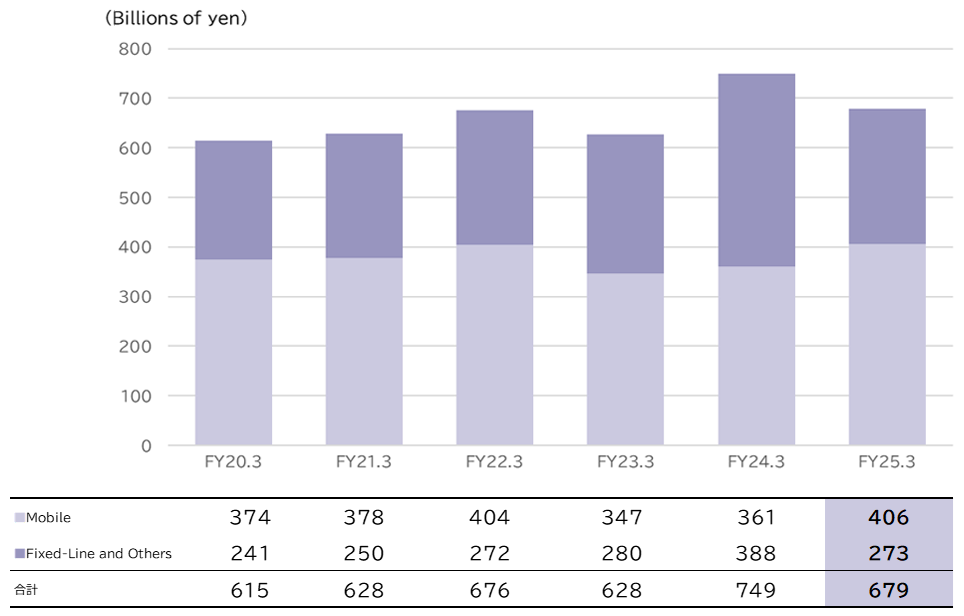
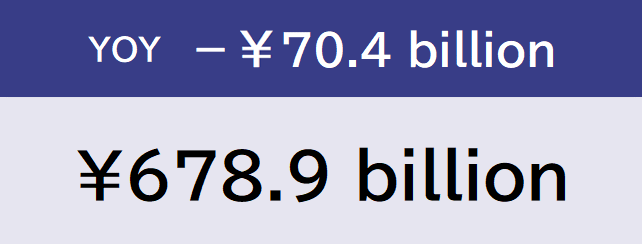
Although investment in focus areas (such as Data enters and AI) increased, capital expenditures decreased by ¥3.9 billion compared to the previous period to ¥679.0 billion, due to the peak-out of capital investment in mobile, centered on 5G.
- *From FY26.3 onward, capital expenditures have been redefined to include items such as changes in consumption tax; therefore, the figures do not match the combined total of mobile, fixed-line, and others.
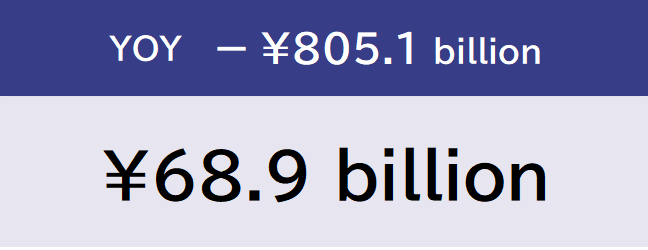
Free Cash Flows
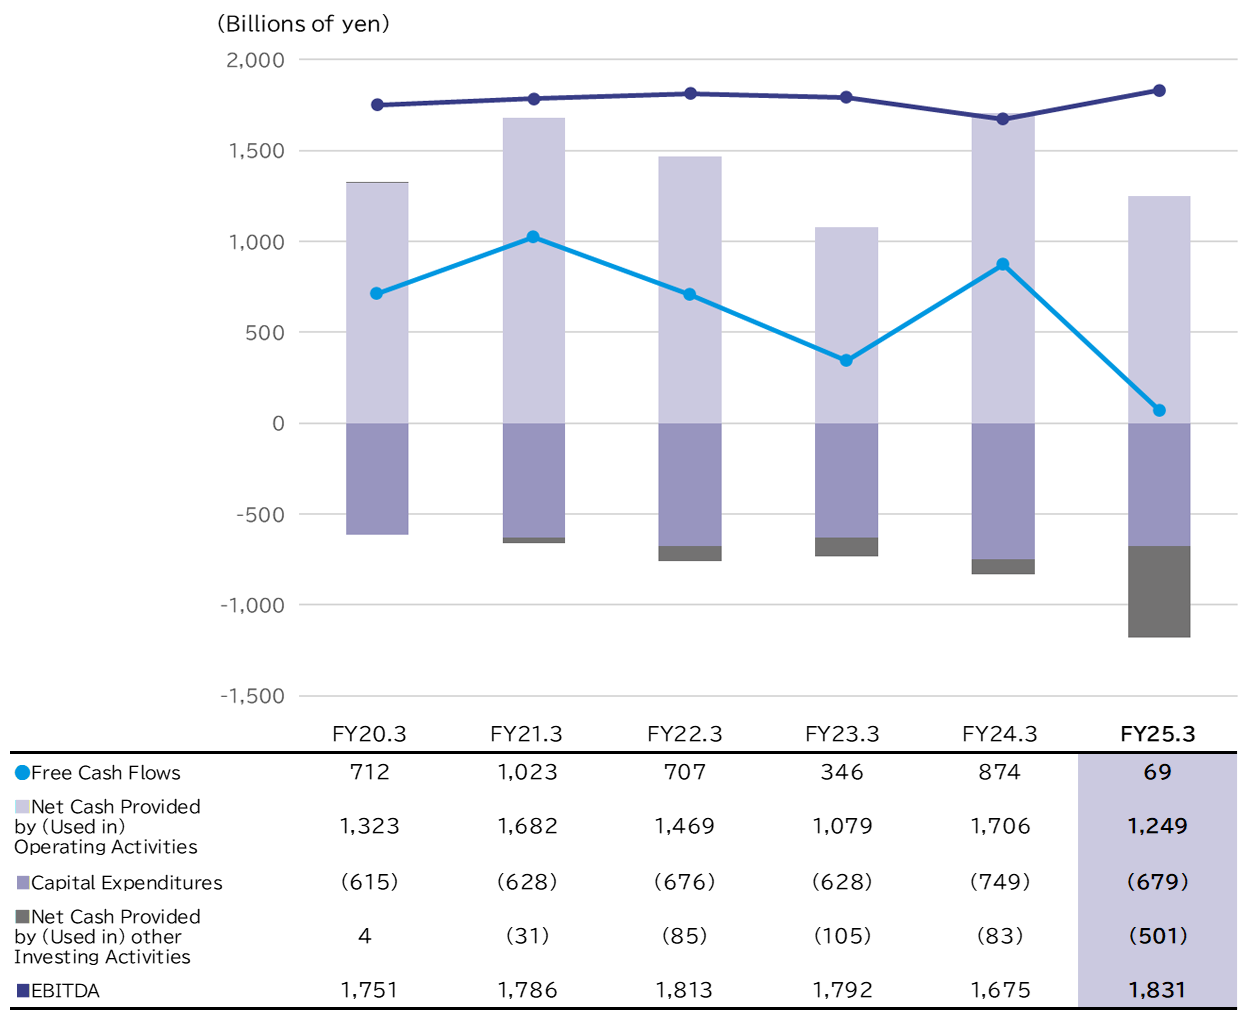
Net cash provided by operating activities (revenue) increased by ¥539.8 billion year-on-year to ¥1,788.9 billion. This was due to an increase in revenue from factors such as a larger increase in deposits in the financial business, despite a decrease in revenue from a smaller increase in borrowings in the same business.
Cash flow used in investing activities (expenditure) decreased by ¥99.6 billion year-on-year to ¥1,080.5 billion. This was mainly due to a decrease in expenditures from the acquisition of shares of affiliated companies such as Lawson in the previous period.
- *Certain figures for FY2025.3 and FY2026.3 have been revised in results of the Special Investigation Committee and audits by the accounting auditors.