- KDDI HOME
 Corporate Information
 - Investor Relations
- Financial Data
- Result and Forecast
Result and Forecast
Consolidated Statement
Historical chart Operating revenue
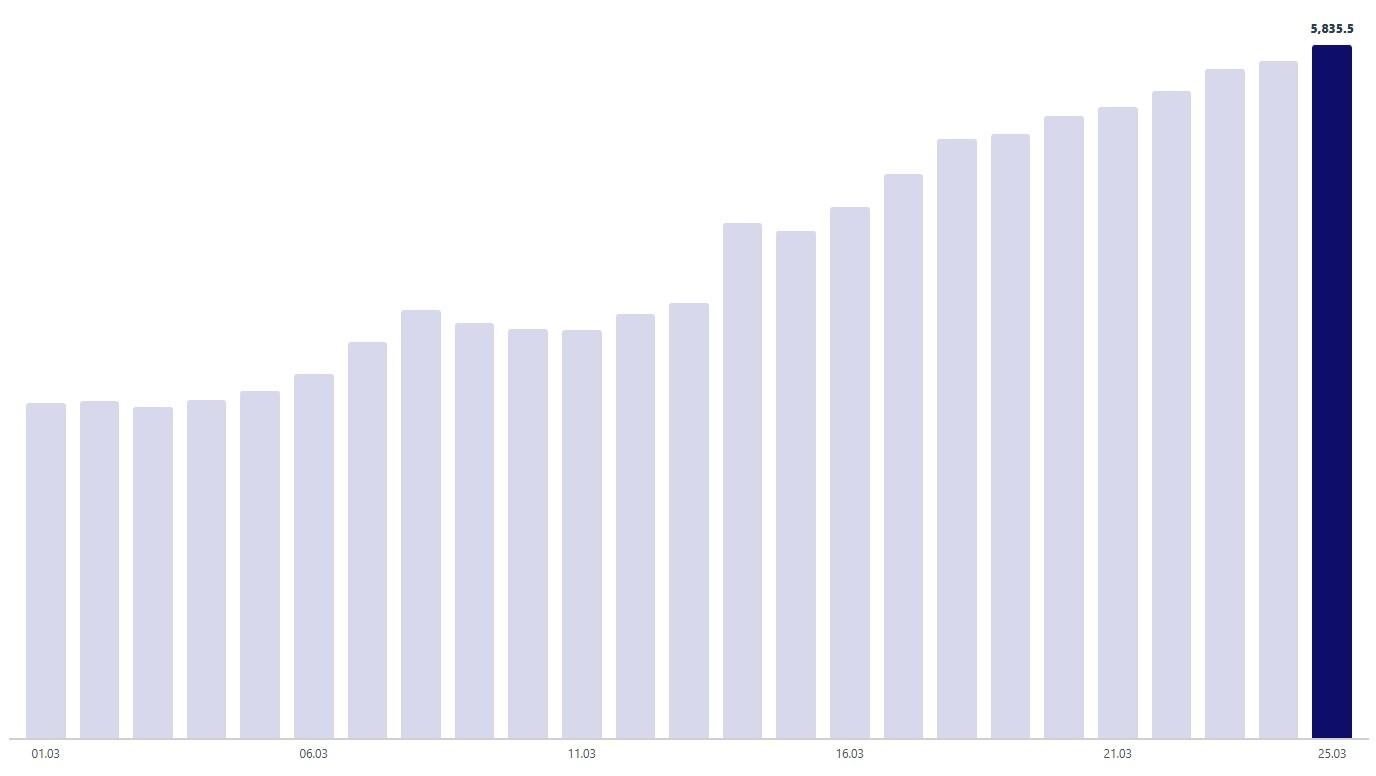
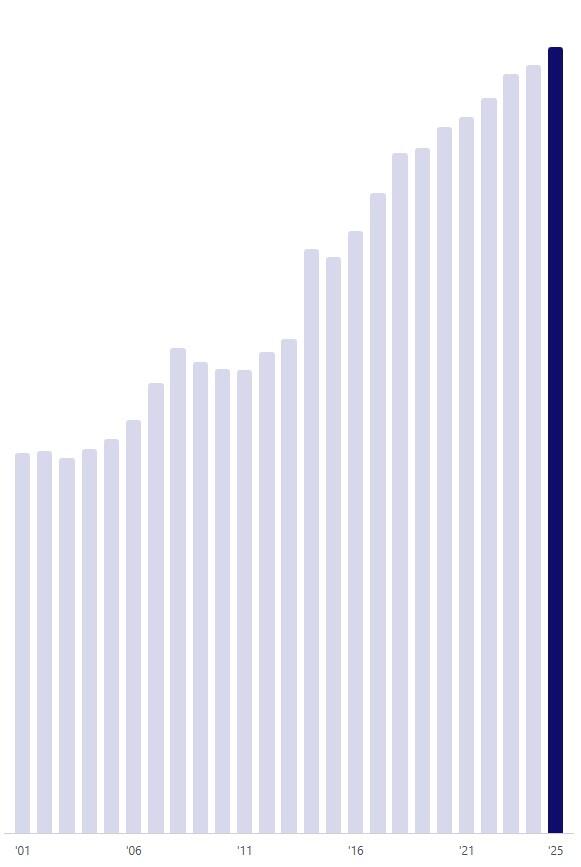
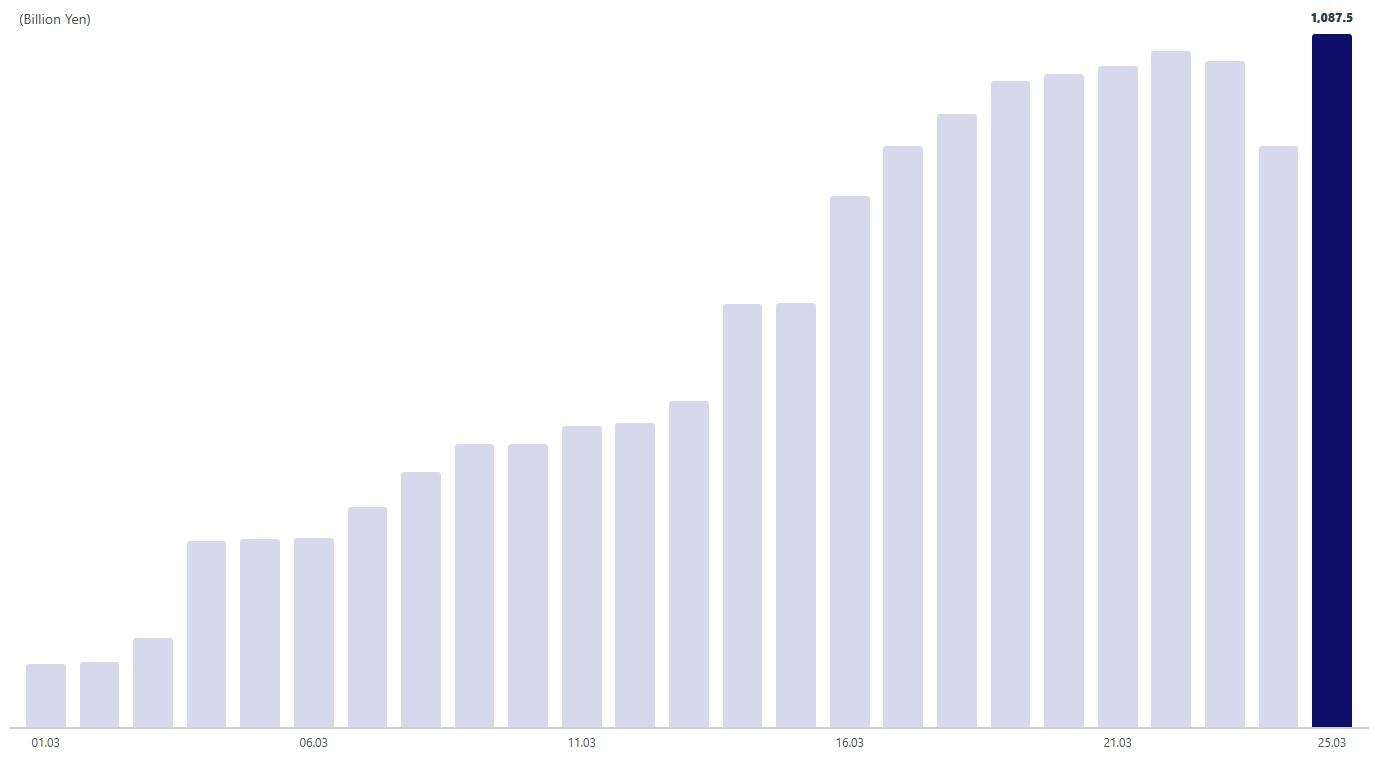
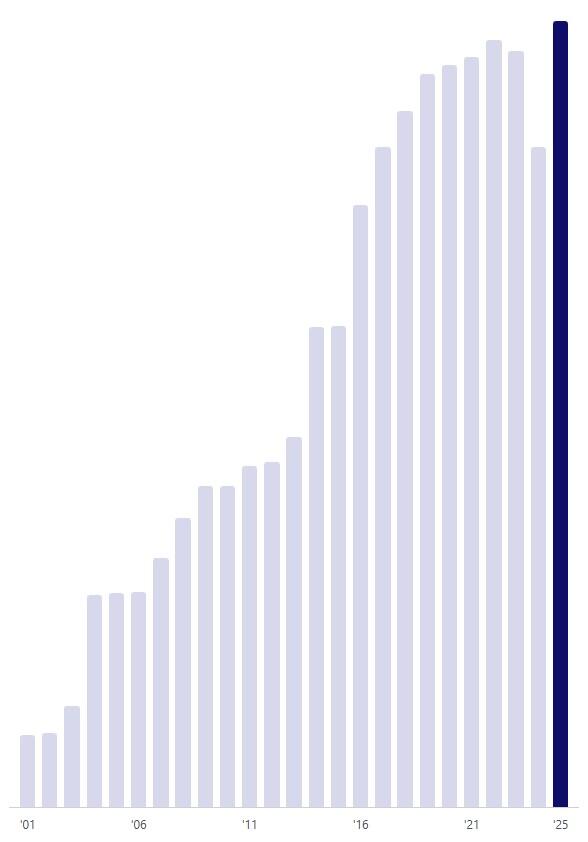
Japanese GAAP through the fiscal year ended March 2014; IFRS (International Financial Reporting Standards) from the fiscal year ended March 2015
Historical chart Operating income
Consolidated revenue for the fiscal year ended March 2026 were 6,071.9 billion yen, an increase of 4.1% compared to the previous fiscal year. Consolidated operating income increased by 1.1% from the previous fiscal year to 1,099.1 billion yen due to growth driven by Finance, Energy, Lawson, and DX.
The Company projects consolidated operating revenue of 6,410.0 billion yen (yoy +5.6%) and adjusted operating income [1] of 1,210.0 billion yen (yoy +5.0%) for the fiscal year ending March 2027.
- [1]Adjusted Operating income: A metric designed to visualize underlying growth potential by excluding non-recurring and large-scale costs from operating profit. Starting from FY28-03, IFRS 18 "Presentation and Disclosure in Financial Statements" will be applied, and Management-defined Performance Measures (MPM) will be subject to strict management. To visualize our growth potential and maintain/improve capital efficiency, we have proactively introduced and disclosed this metric starting from the FY27-03 earnings forecast.
Performance by Business segment
- Results for FY 3/2026
-
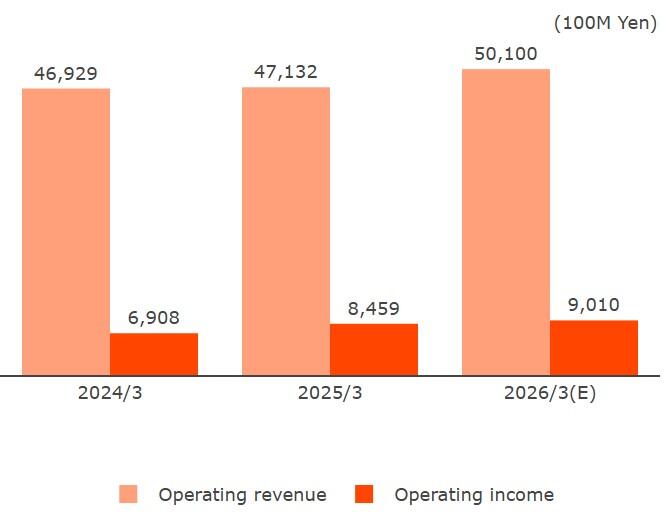
Operating revenue was 4,812,737 million yen, driven by an increase in financial business revenue in addition to telecommunications-based mobile revenue.
Operating income was 828,337 million yen, despite the increase in net sales, this decrease was due to factors such as the impairment of contract costs related to churners that had been capitalized in previous periods.
- Results for FY 3/2026
-
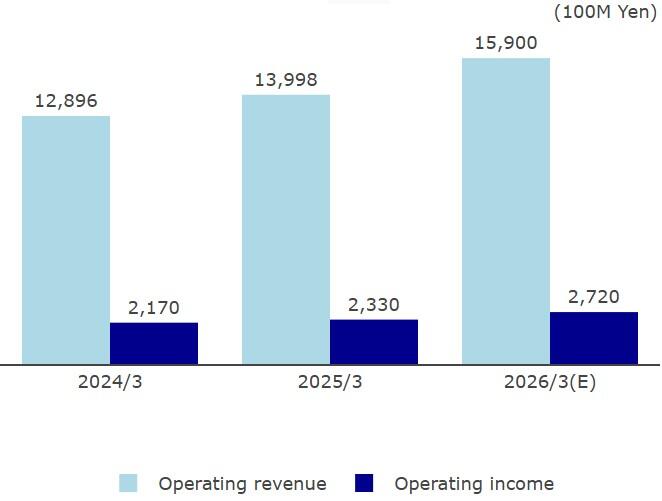
Operating revenue was 1,527,914 million yen, driven by an increase in revenue from growth in the Growth area, which includes IoT-related services and Data Center.
Operating income was 263,884 million yen, primarily due to the increase in operating revenue.
In May 2026, KDDI announced its mid-term management strategy for FY27-03 to FY29-03. KDDI will transform into a new growth structure by enhancing enterprise value through sustainable growth and quality improvement in the AI era.
By defining new segments―Telecom Core, Business Growth, and Personal Growth―KDDI aims to generate profit growth and investment capital in Telecom Core while accelerating growth in Growth segments and pursuing synergies across segments. In addition, building an AI service foundation in Growth segments on the Telecom Core base aims to create synergies that enhance engagement in Telecom Core.
For more information on the business overview of the new segments, please refer to"KDDI Business segments".
For more detailed financial information, please refer to the "Financial results presentation".